By Lak Lakshmanan, Technical Lead Big Data Professional Services and Matthew Feigal, Google Cloud Customer Engineer
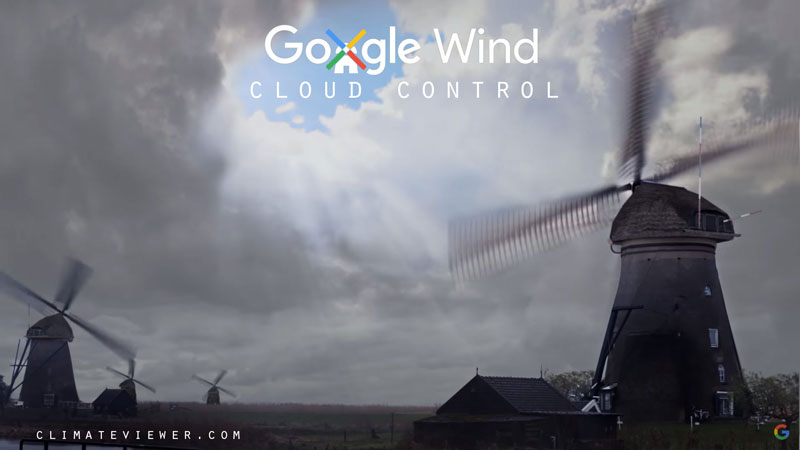
How Google Wind uses machine learning to predict rain and then orchestrate Dutch windmills accordingly
Holland is one of the greatest countries to live in, but the one downside is that it rains most of the time. Rainfall has increased in the last century (18% since 1906, source KNMI), making the Dutch complain about the weather more than ever. That’s why Google Netherlands Cloud Platform team is launching Google Wind.
We leveraged existing Dutch infrastructure to realize this moonshot in record time. Google Wind uses machine learning to recognize cloud patterns and orchestrate a network of windmills* when rain is approaching. Test results look very promising, We’re proud to announce that from April 1st we’re able to help ensure clearer skies for everyone in Holland.

The data processing behind it all
After our team instrumented Dutch windmills with internet-enabled sensors, we were able to stream the data into Google Cloud Pub/Sub and into Google Cloud Storage. We were also able to get weather radar data from all the radars in the Netherlands conveniently mosaiced from the European Radar network. These radar grids were ingested into a Google Cloud Dataproc cluster and processed using Apache Spark. The radar data helps us recognize the position and spatial extent of the clouds to compute how to orchestrate the windmills most effectively.
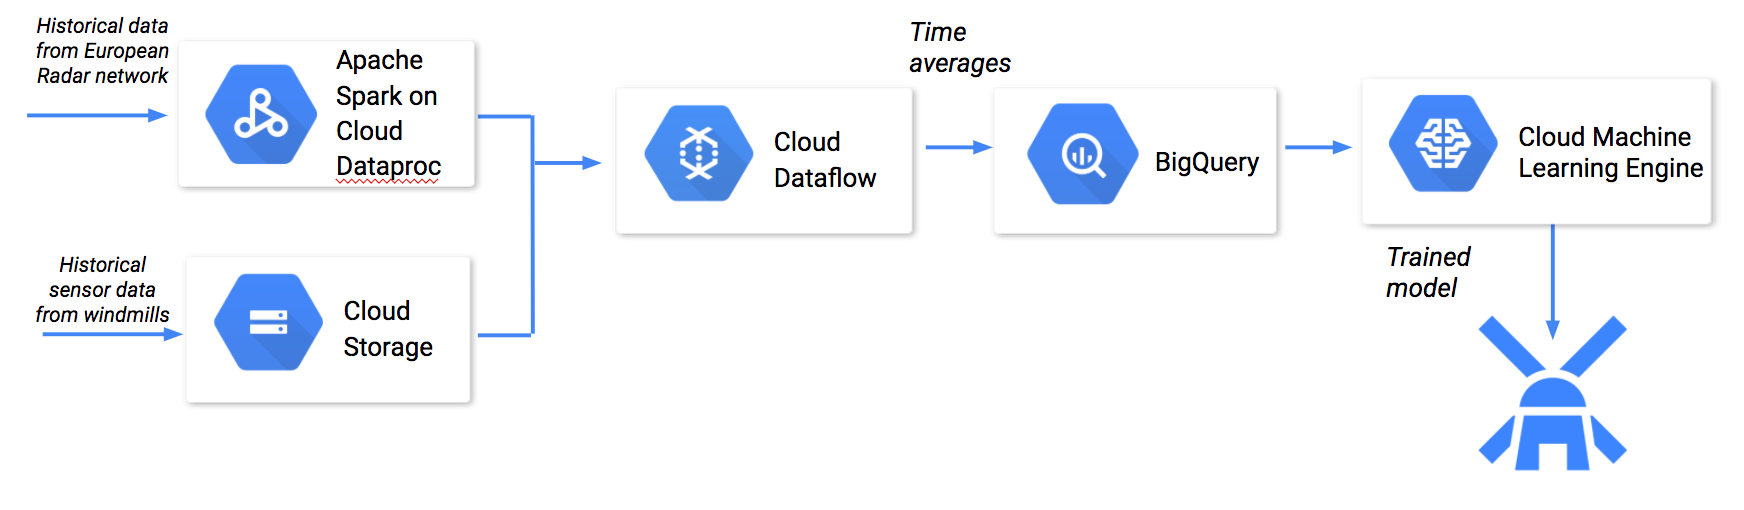
These datasets form the base of our machine learning model. While we used a deep neural network with convolutional and max-pool layers directly on the radar data, the sensor data required temporal averages aligned with the radar data timestamps. We did this using Google Cloud Dataflow and saved the output into Google BigQuery, the petabyte-scale cloud data warehouse. Training the model on this quantity of data required distributed TensorFlow training using Cloud Machine Learning Engine. The resulting model was deployed and used to serve out control actions for the windmills in real-time.

In real-time, the same sensor data and radar data were ingested into Cloud Dataproc and Cloud Pub/Sub. We chose Cloud Pub/Sub to deal gracefully with spikes in usage — especially when coordinated action from the windmills required blowing a lot of hot air all at once. The same Dataflow pipeline used in neural network training was used in serving as well, making the move from training to production quite straight-forward.
The real question was whether the coordinated actions by the network of windmills would successfully move the clouds out of the way. We’re happy to report that ever since we turned on our model, our data centers have experienced 23% more sunlight-hours per solar panel, and have obtained a 42% reduction in energy costs. (note: these measurements are only valid on April 1)
For more technical details about training and serving with the underlying Tensorflow model, see the Jupyter Notebook shared on Github.
*There are up to 1170 available windmills suitable for this opportunity
SOURCE: Using Google Cloud Machine Learning to manage Dutch weather conditions
EDITOR’S NOTE: Many of you know my long history with Google and Google Earth. This April Fool’s joke really put a smile on my face and I hope this can make you laugh too. After you are done laughing, check out the truth about weather control on Weather Modification History!
![]()

“I am forever a Boy Scout, lifetime artist, nocturnal programmer, music is my life, love is my religion, and I am the luckiest husband and father on Earth. I speak for the trees. I have a passion for mapping, magnets, and mysteries.”
About Jim Lee")