On March 11, 2011 a 9.0 magnitude earthquake hit Sendai, Japan sending a massive tsunami crashing into the Fukushima-Daiichi nuclear power plant, destroying cooling pumps located on the beach. As a result, the nuclear furnace inside the crippled plant overheated, leading to a meltdown. Basically, the interior of the reactor got so hot that its fuel rods melted through its metal container, through the concrete “safety net” below, and is now in the ground under the power plant. This super-hot material is now in contact with groundwater and seawater, producing radioactive steam and ocean pollution (300 tons/day). Over 100,000 Japanese citizens were evicted from their land, never to return home and praying they don’t develop cancers or mutations like those in Chernobyl did. Within the first four days following the tsunami, three seperate explosions released massive amounts of radioactive fallout worldwide, with the majority depositing (rain) over Tokyo, the United States of America, and the Pacific Ocean. The WORST part: TEPCO and the Japanese government did not admit a meltdown had occurred for two months! Fukushima-Daiichi is still raining death on land, sea, and air two years later, and the media blackout continues:
Officials in Japan have now admitted that the Fukushima-Daiichi radiation release was much higher than initially reported, and now we are hearing that the amount of oceanic pollution is also in dispute. This means that every computer model based on the bogus claims of TEPCO and the Japanese government are inaccurate and misleading. A very desperate TEPCO is now attempting to build an underground ice wall to contain leaks.Fukushima media coverage “may be harmful”
One report, in UK newspaper The Independent, quoted a scientist who predicted more than a million would die, and that the prolonged release of radioactivity from Fukushima would make health effects worse than those from the sudden release experienced at the Chernobyl nuclear reactor in Ukraine. “We’ve got to stop these sorts of reports coming out, because they are really upsetting the Japanese population,” says Gerry Thomas at Imperial College London, who is attending the meeting. “The media has a hell of a lot of responsibility here, because the worst post-Chernobyl effects were the psychological consequences and this shouldn’t happen again.”
source: New Scientist
- TEPCO's claims are not to be trusted. Their lies are well documented, and their numbers are speculation.
- TEPCO does not know the following:
- Which nuclear materials are in the water and in what amounts (strontium, tritium, plutonium, cesium)
- The rate of water leaving the plant
- The level of radioactivity of the water.

Even though the nuclear industry’s perception managers are working overtime to ensure the public will never be able to point the finger squarely their way, the entire world has been negatively affected by the March 11, 2011 meltdown of the Fukushima-Daiichi nuclear power plant. Listen to my 3 hour discussion on the public relations side of this debacle.
Believe none of what you hear, and half of what you see
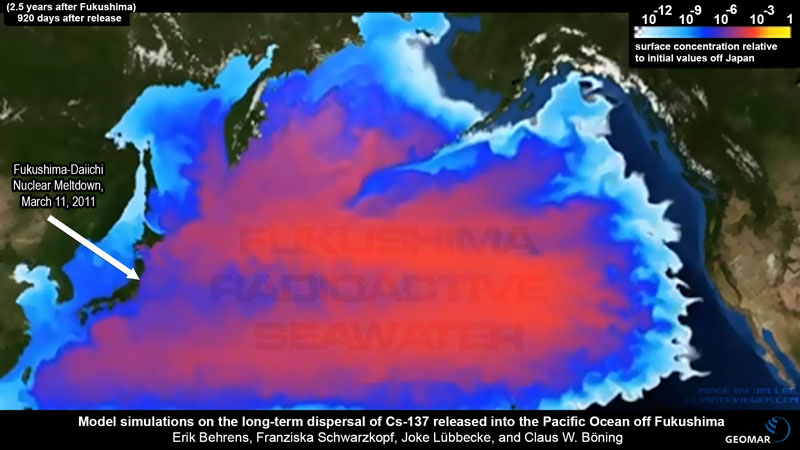
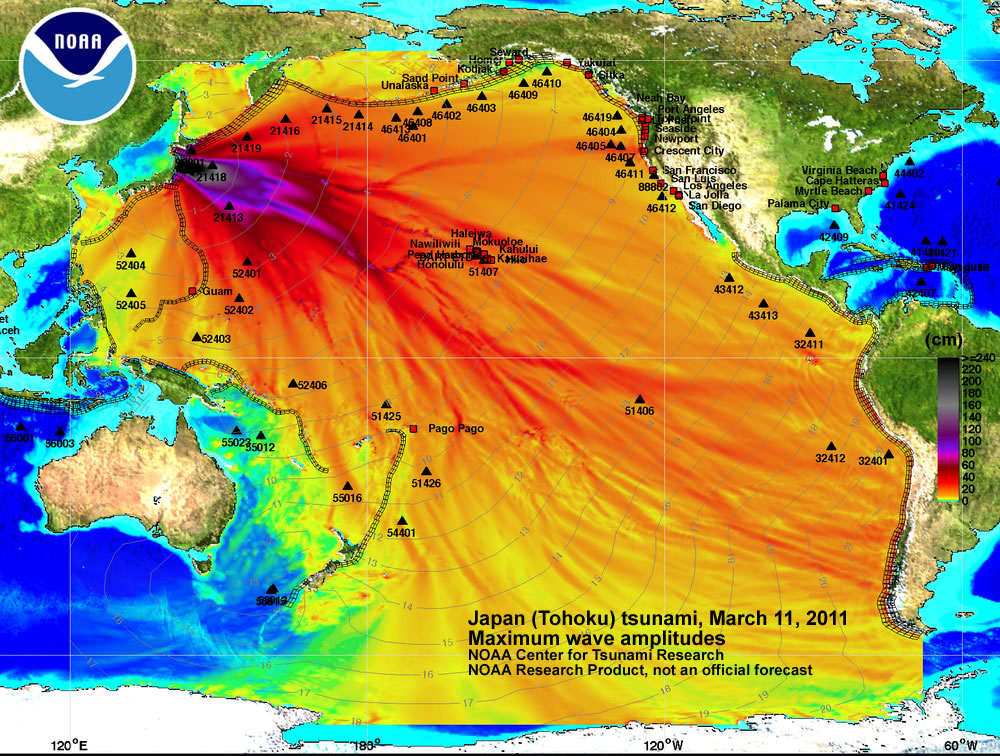
Many blogs and social media users posted the following NOAA tsunami energy plot map, erroneously claiming (as did I, a year ago) that it was a model of Fukushima-born Cesium-137 crossing the Pacific ocean.
The image above, from the NOAA Center for Tsunami Research, shows wave heights using rainbow colors with a legend clearly visible. Here is another version of this image, with all the proper labeling:
Now that we’ve cleared that up, can we find an actual model of Cesium-137 crossing the Pacific please?
To replace the improperly over-used image above, I created the following image from a video presentation in the research linked below.

Model simulations on the long-term dispersal of 137Cs released into the Pacific Ocean off Fukushima
Behrens, Erik, Schwarzkopf, Franziska, Lübbecke, Joke and Böning, Claus W. (2012) Model simulations on the long-term dispersal of 137Cs released into the Pacific Ocean off Fukushima Environmental Research Letters, 7 (3). 034004. DOI 10.1088/1748-9326/7/3/034004.A sequence of global ocean circulation models, with horizontal mesh sizes of 0.5°, 0.25° and 0.1°, are used to estimate the long-term dispersion by ocean currents and mesoscale eddies of a slowly decaying tracer (half-life of 30 years, comparable to that of 137Cs) from the local waters off the Fukushima Dai-ichi Nuclear Power Plants. The tracer was continuously injected into the coastal waters over some weeks; its subsequent spreading and dilution in the Pacific Ocean was then simulated for 10 years. The simulations do not include any data assimilation, and thus, do not account for the actual state of the local ocean currents during the release of highly contaminated water from the damaged plants in March–April 2011. An ensemble differing in initial current distributions illustrates their importance for the tracer patterns evolving during the first months, but suggests a minor relevance for the large-scale tracer distributions after 2–3 years. By then the tracer cloud has penetrated to depths of more than 400 m, spanning the western and central North Pacific between 25°N and 55°N, leading to a rapid dilution of concentrations. The rate of dilution declines in the following years, while the main tracer patch propagates eastward across the Pacific Ocean, reaching the coastal waters of North America after about 5–6 years. Tentatively assuming a value of 10 PBq for the net 137Cs input during the first weeks after the Fukushima incident, the simulation suggests a rapid dilution of peak radioactivity values to about 10 Bq m−3 during the first two years, followed by a gradual decline to 1–2 Bq m−3 over the next 4–7 years. The total peak radioactivity levels would then still be about twice the pre-Fukushima values.
View this model on YouTube. Download the PDF. Source: Geomar
Conclusion
My personal decision to abstain from eating ocean-born fish may be unfounded, however given the vast amounts of unknowns concerning bio-accumulation of Fukushima-Daiichi nuclear contaminants, I choose to err on the side of caution. There is substantial evidence that every inch of the Pacific Ocean will contain some remnant of the March 11, 2011 nuclear meltdown, and that those materials will negatively impact all those who consume it. The sustained release of radioactive water into the Pacific, FOR THE PAST TWO AND A HALF YEARS, is the greatest environmental disaster since the Cold Wars' irradiation of the planet with 2,000 plus nuclear explosions.God save the people of Japan.
~ Jim Lee
Please be sure to check out ClimateViewer 3D, mapping out our planetary problems, in 3D!

“I am forever a Boy Scout, lifetime artist, nocturnal programmer, music is my life, love is my religion, and I am the luckiest husband and father on Earth. I speak for the trees. I have a passion for mapping, magnets, and mysteries.”
About Jim Lee")